Story View
The story view shows how one page performed against the rest of your site. It sits under Content, but has no sidebar entry; you open it by clicking a story.
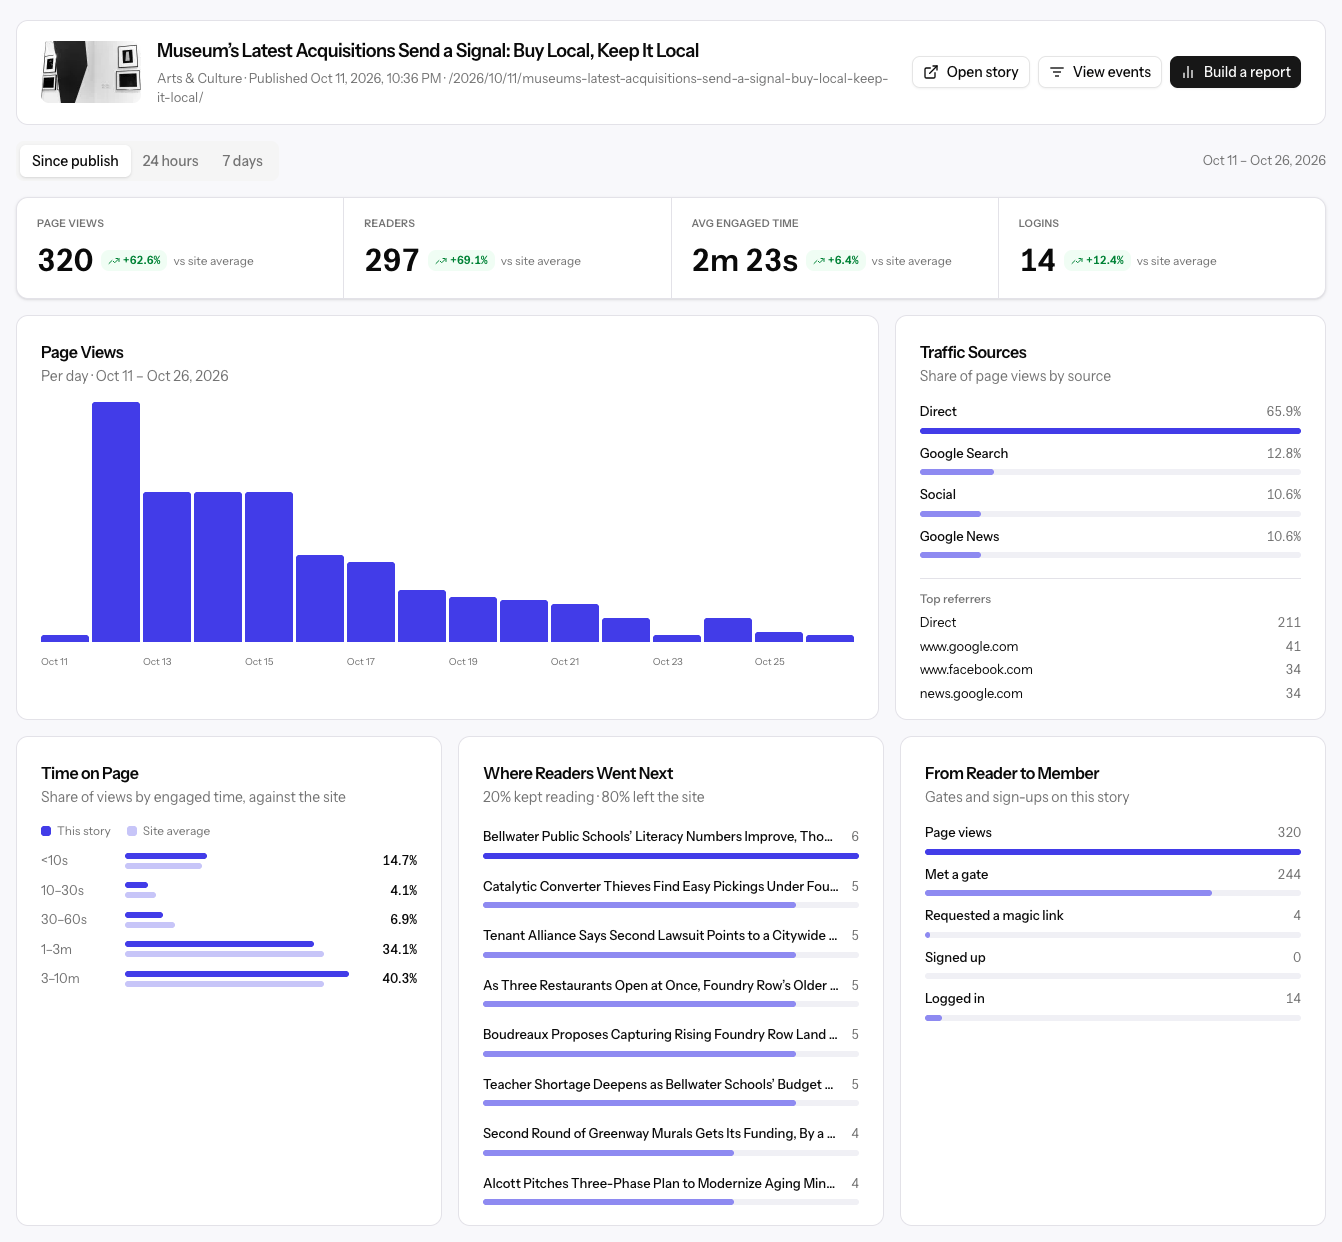
Opening a story
Click a story title almost anywhere it appears:
- Spiking on the Pulse
- Top Content by Engaged Time on the Dashboard and the Page views view
- The Content catalog and recommendation cards
- View this story's analytics in an event's details
- Where Readers Went Next on another story
Header and window
The header shows the story's thumbnail, title, section, authors, publish date, and path. A Live badge appears for stories published in the last 24 hours.
| Button | What it does |
|---|---|
| Open story | Opens the story on your site in a new tab. |
| View events | Opens the Events explorer filtered to this page. |
| Build a report | Opens the report builder with this story's page views by referrer. |
Pick a window under the header: Since publish (the default), 24 hours, or 7 days. If Allegro doesn't know when the story was published, it shows the last 30 days.
What you see
The stats compare the story's Page views, Readers, Avg engaged time, and Logins with your site's average story over the same window.
| Card | What it shows |
|---|---|
| Page Views | Views per hour or day across the window. |
| Traffic Sources | Each channel's share of views, plus the top referring sites. |
| Time on Page | How long views lasted, in bands from under 10 seconds to 10 minutes, beside the site average. |
| Where Readers Went Next | The pages readers opened next in the same visit, with the share who kept reading or left the site. |
| From Reader to Member | Page views, then how many met a gate, requested a magic link, signed up, and logged in on this story. |
| Gates on This Story | Each gate type's views, and how often it led to a sign-up request or a login. |