Analytics
Analytics shows how readers find, read, and act on your site, built from the events the Allegro SDK records on every page. Open it from Analytics in the sidebar. Its pages:
| Page | What it answers |
|---|---|
| Pulse (this page) | What is happening on the site in the last hour? |
| Events | What happened over a period, and what did each reader do? |
| Reports | Which views does your team come back to? Build and share your own. |
Anyone in your organization can view Analytics, including viewers.
Analytics data comes from events sent by the Allegro SDK. Make sure the Script Tag is loaded on every page you want to track.
The Pulse
The Pulse is the page you land on when you click Analytics. A green Live badge sits beside the title, and the page refreshes itself every 30 seconds, so you can leave it open on a second screen.
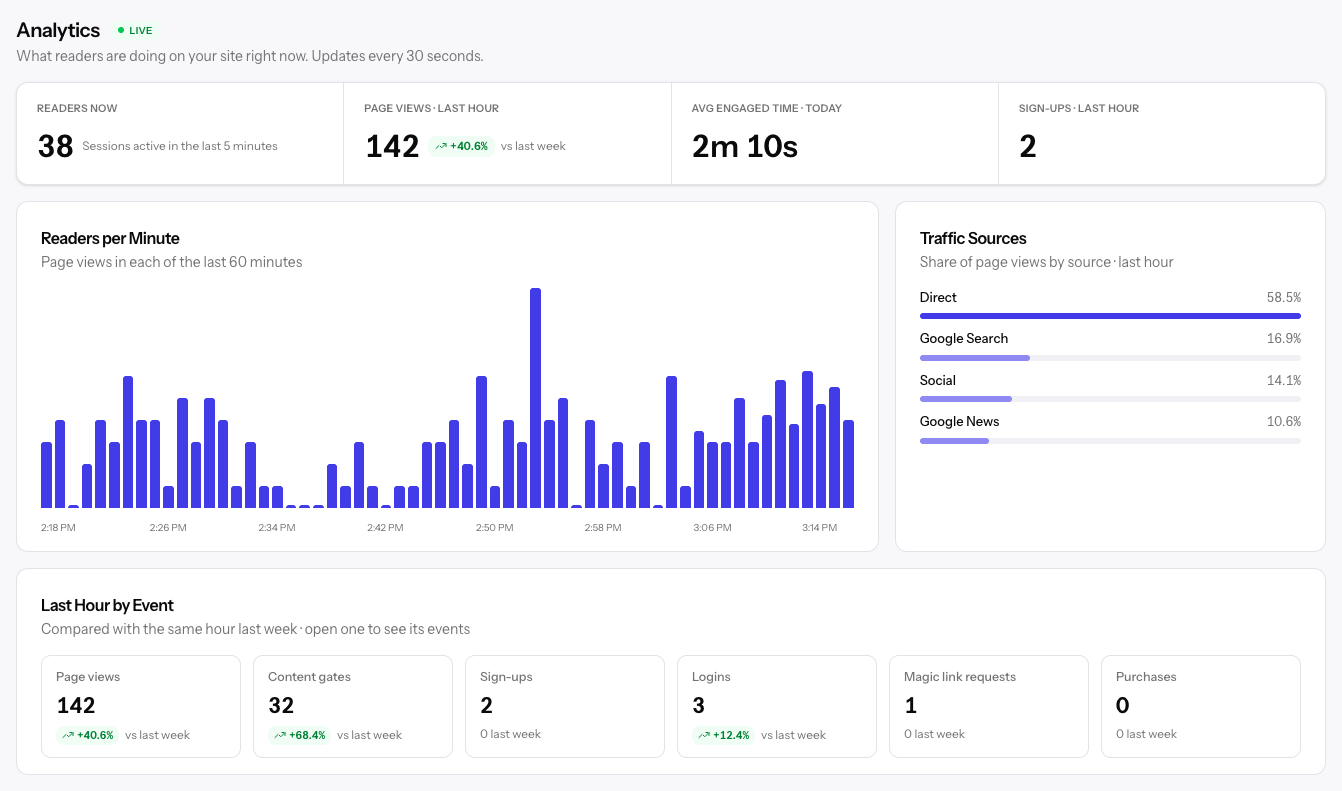
Headline numbers
| Number | What it counts |
|---|---|
| Readers now | Sessions active in the last 5 minutes. |
| Page views · last hour | Page views in the last 60 minutes, compared with the same hour a week ago. |
| Avg engaged time · today | Average engaged time since midnight. |
| Sign-ups · last hour | New member sign-ups in the last 60 minutes, compared with last week. |
Comparing with the same hour last week, rather than the hour before, keeps the normal rise and fall of a day from looking like a trend.
Cards
| Card | What it shows |
|---|---|
| Readers per Minute | Page views in each of the last 60 minutes. |
| Traffic Sources | Each source's share of page views in the last hour, grouped into traffic channels. |
| Last Hour by Event | Page views, content gates, sign-ups, logins, magic link requests, and purchases in the last hour, each against the same hour last week. Click a tile to open its Events view. |
| Spiking | Stories running furthest above their usual pace: views in the last 30 minutes, the typical count, and the lift (for example 3.2×). Click a story to open its story view. |
| Top Referrers | The external sites sending readers in the last hour, with their channel, page views, and sessions. |
| Pinned Reports | Links to the saved reports your team pinned. The card appears once a report is pinned. |
Filters shared across Analytics
Property
If your organization has more than one property, a property selector appears in the page header. Pick a property to scope every number on the page to it, or All properties to see the whole organization. The choice carries over as you move between Analytics pages.
Product
On the Events views, a second selector, All readers, lets you narrow the numbers to members of one product. Use it to compare how paying members read against everyone else.
Date range
The Events views share a range control: 7d, 30d (the default), 90d, 1y, or Custom for any start and end date up to a year apart. Ranges are whole calendar days in your organization's time zone and include today.
Every stat compares the range with the period of the same length just before it, so 30d compares the last 30 days with the 30 days before that. Charts show hours for ranges of two days or less, days up to about four months, and weeks beyond that.
Today is still in progress, so the last bar of a chart is usually shorter than the rest. Pick a Custom range that ends yesterday when you want only complete days.
Traffic channels
Analytics groups every referrer into a channel so you can see at a glance where readers come from.
| Channel | Includes |
|---|---|
| Direct | Visits with no referrer, such as typed URLs, bookmarks, and many app links. |
| Search | Google, Bing, DuckDuckGo, Yahoo, Ecosia, Brave, Baidu, and Yandex. Shown by engine, such as Google Search. |
| News aggregators | Google News, Yahoo News, Flipboard, Apple News, MSN, NewsBreak, and SmartNews. Shown by name. |
| Social | Facebook, Instagram, X (Twitter), LinkedIn, Reddit, Threads, Bluesky, Pinterest, TikTok, YouTube, and Nextdoor. |
| Other sites | Every other referring site. |
Subdomains count toward their site, so m.facebook.com is Social. News
aggregators win over search, so a visit from news.google.com is Google News,
not Google Search.
When data is unavailable
If the analytics service can't be reached, each affected card shows an Unavailable message instead of its numbers. The rest of the page keeps working; reload in a minute to try again.