Milestones
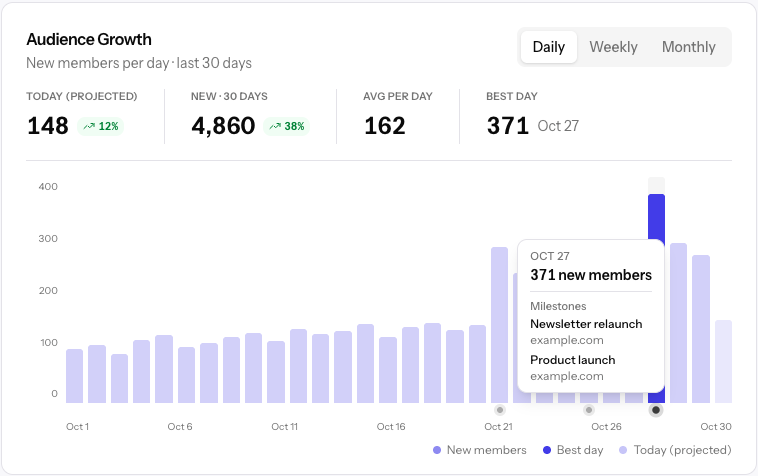
A milestone is a dated note: a product launch, a site relaunch, the day a national newspaper featured you. Every analytics chart that covers that date shows it, so a spike or a dip months later comes with its reason attached.
Where milestones appear
A small dot under a chart's bar or point marks each milestone. Hover the bar to see the milestone's title, note, and link in the tooltip, alongside the numbers. When several milestones share a bar, the tooltip lists them all.
Milestones appear on:
- The Dashboard's Audience Growth and Logins charts
- Every Events chart, such as Page views, Sign-ups, and All events
- Saved reports and the report builder's preview
- A story's performance chart
- An interaction's report
The Pulse doesn't show milestones, since it only covers the last hour.
On a chart grouped by week or month, a milestone marks the bar that contains its date. On an hourly chart, it marks the first hour of its day. If a chart has no bar for that day, because nothing happened, the chart shows no marker for it.
Screen readers get the same information: the chart's data table lists each row's milestones.
Adding a milestone
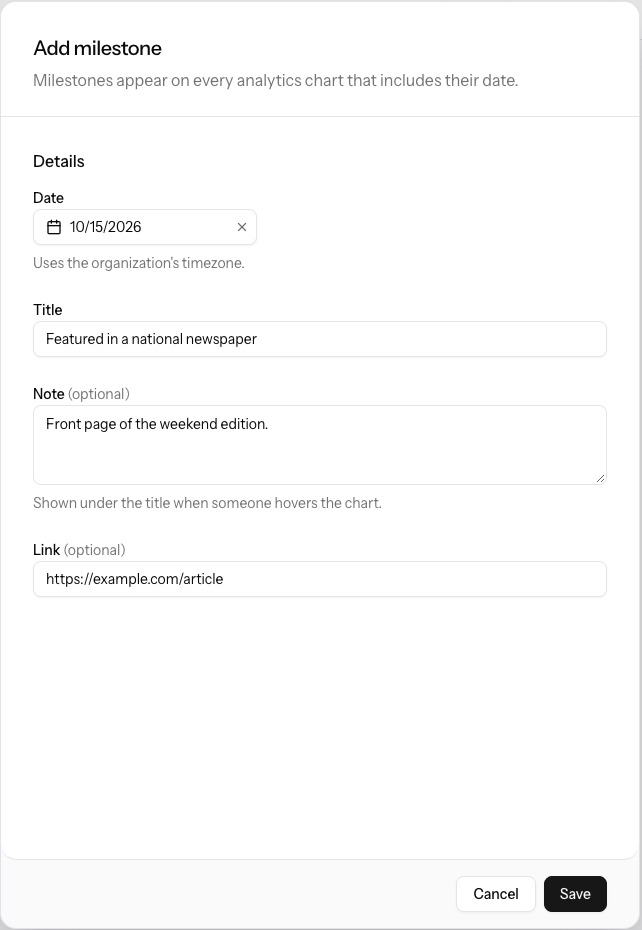
Go to Settings → Milestones and click Add milestone.
| Field | What it sets |
|---|---|
| Date | Required. A single day, past or future, in your organization's timezone. |
| Title | Required. Up to 120 characters. Shown on the chart tooltip and in the list. |
| Note | Optional. Up to 1,000 characters of context, shown under the title in the tooltip. |
| Link | Optional. An http or https address, such as the article that featured you. |
| Properties | Optional. Limits the milestone to some properties. Leave all unchecked to show it everywhere. |
To change or remove a milestone, click it in the list. Delete milestone is at the bottom of the drawer.
Only admins can add, edit, or delete milestones. Everyone in your organization sees them on charts.
Limiting a milestone to properties
If your organization runs more than one property, a milestone can belong to some of them. A redesign of one site, for example, shouldn't mark the charts of another.
| Charts filtered to | Milestones shown |
|---|---|
| The whole organization (no filter) | Every milestone |
| A property the milestone is limited to | The milestone, plus every milestone with no properties checked |
| Any other property | Only milestones with no properties checked |
Deleting a property also deletes the milestones limited to that property alone. Milestones that list other properties too keep those.
Milestones in the assistant, API, and MCP
The analytics assistant sees the milestones inside the range it's looking at, so it can point out when a change in the numbers lines up with one.
Milestones can also be managed from your own systems:
| Action | API endpoint | MCP tool |
|---|---|---|
| List milestones | GET /v1/milestones | list-milestones-tool |
| Add a milestone | POST /v1/milestones | create-milestone-tool |
| Read one milestone | GET /v1/milestones/{id} | |
| Edit a milestone | PUT /v1/milestones/{id} | update-milestone-tool |
| Delete a milestone | DELETE /v1/milestones/{id} | delete-milestone-tool |
API keys need the milestones:read scope to list and read, and
milestones:write to change them. The MCP analytics tools that return a chart's
data include the milestones in its range as well. See
Analytics API and MCP for setting up keys.