Reports
Reports collects every view Analytics offers in one place, plus the reports your team builds. Open it from Analytics → Reports in the sidebar.
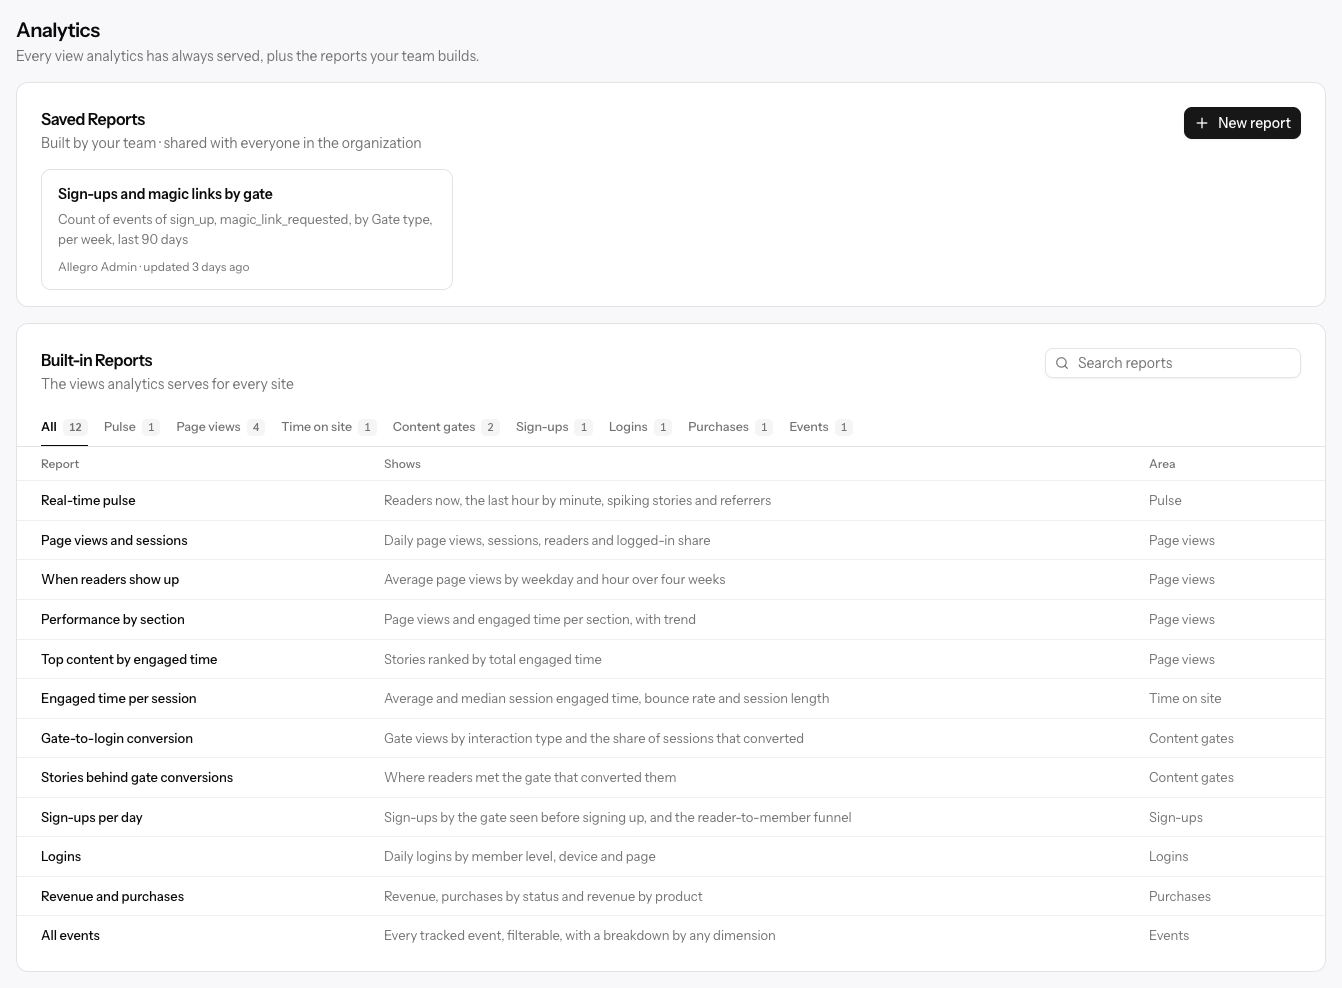
Built-in reports
Built-in Reports lists the views Analytics serves for every site, such as Real-time pulse, When readers show up, and Gate-to-login conversion. Each one links to the page that shows it. Use the area tabs (Page views, Content gates, Sign-ups, and so on) or Search reports to find one. The search also filters your saved reports.
Built-in reports can't be edited or deleted.
Saved reports
Saved Reports holds the reports your team has built. Each card shows the report's name, its description or a one-line summary, who made it, and when it was last updated. Pinned reports come first.
Saved reports are shared: everyone in your organization can open every one.
| Role | Open reports | Create, edit, and delete reports |
|---|---|---|
| Admin | ✓ | ✓ |
| Member | ✓ | ✓ |
| Viewer | ✓ |
Admins and members can edit or delete any saved report, not only their own.
Building a report
Click New report, or start from what you're already looking at:
- Turn into report in the Events explorer brings your event types, filters, and breakdown with it.
- Build a report on a story view starts from that story's page views by referrer.
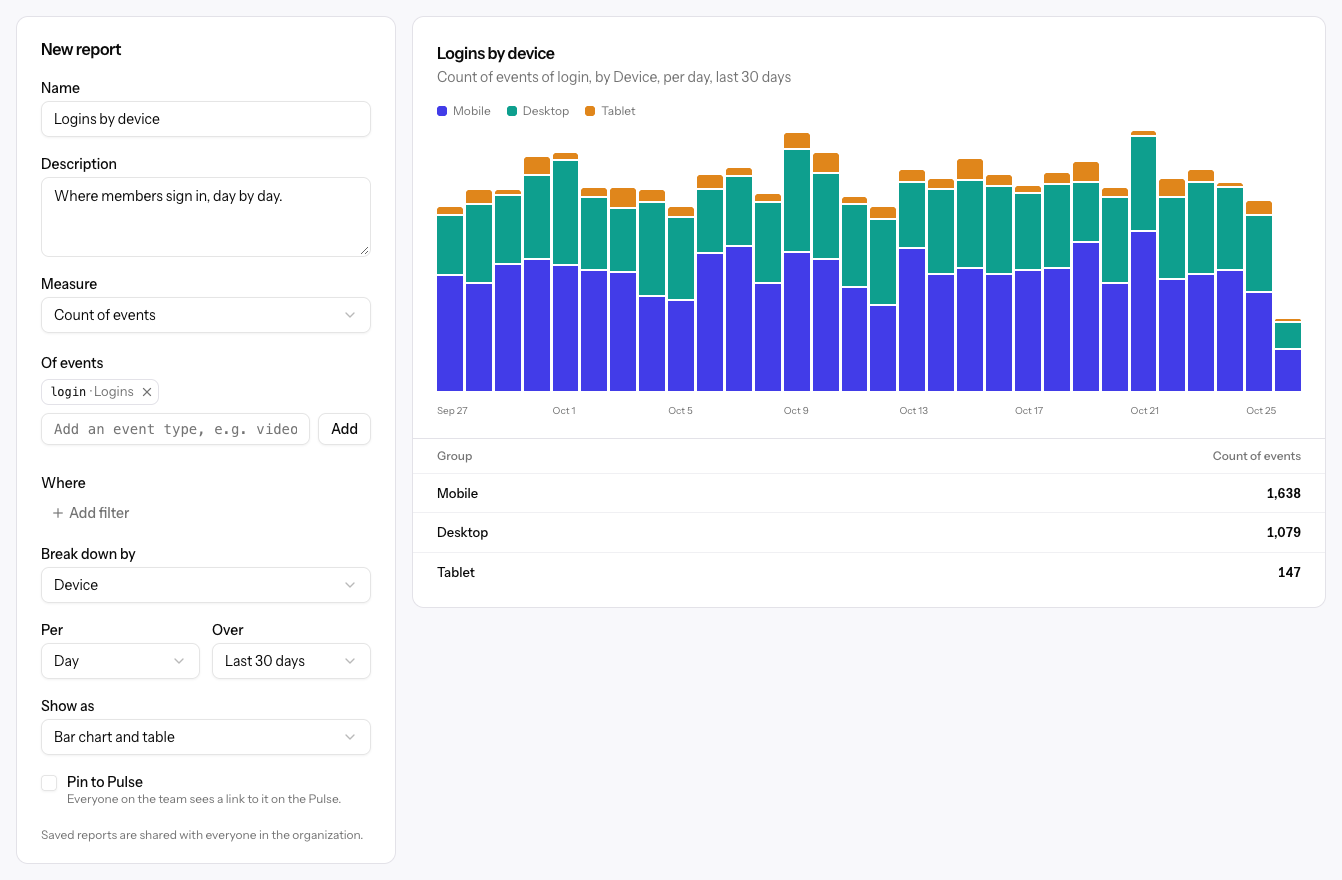
The form is on the left and a live preview on the right, which updates as you change any field.
| Field | What it sets |
|---|---|
| Name | Required. Shown on the report card and page. |
| Description | Optional. Shown in place of the generated summary. |
| Measure | What to count: Count of events, Unique sessions, Unique readers, Unique registered readers, Engaged time, or Average engaged time. |
| Of events | The event types to include, up to 20. Leave it empty for all events. Custom event names work too. |
| Where | Up to 10 filters, with the same fields and matches as the Events explorer. |
| Break down by | Nothing, or any field from the explorer. The top 8 values each get their own series. |
| Per | Hour, Day, Week, or Whole range for a single total per group. |
| Over | Last 7 days, Last 30 days, Last 90 days, or Last 12 months. |
| Show as | Bar chart and table, Area chart and table, Line chart and table, or Table only. An area chart stacks the groups so you can see each one's share; a line chart draws each group on its own line. |
| Pin to Pulse | Adds a link to the report on the Pulse for everyone on the team. |
Click Save report to save it and open it.
Saved reports always cover a rolling window, so a report built over Last 30 days shows the latest 30 days every time you open it. Custom date ranges aren't available in reports.
Pin to Pulse
Pinned reports appear in a Pinned Reports card on the Pulse, so the views your team checks every day are a click away. A Pinned to Pulse badge marks them on their own page.
Viewing a report
A report's page shows its name, description, who created it, and a Results card with the chart and a table of each group's total for the report's window, in your organization's time zone.
Admins and members also see Edit report and Delete. Deleting asks you to confirm, because everyone in the organization loses access to the report.
Report emails
Anyone who can view a report can have it delivered by email on a schedule, so the numbers your team watches arrive without anyone opening the dashboard. Both saved reports and most built-in reports can be emailed; the real-time pulse, heat maps, and open-ended explorations can't, because they don't reduce to a periodic summary.
Each scheduled email is a single digest with a section for every report you get at that frequency — not a separate email per report. A section shows the report's headline total and how it changed against the previous period, then a short breakdown or trend. The figures are counted in your organization's time zone, so they match the dashboard.
Subscribing
Open a saved report and select Subscribe, or use the Subscribe button on an emailable built-in report in the Reports list. The dialog offers:
| Choice | What it does |
|---|---|
| How often | Weekly (sent Mondays at 6am in your organization's time zone, covering the week before) or Monthly (the first Monday of the month, covering the month before). |
| Send it to me | Subscribes your own address at the chosen frequency. If you already get the report, the button switches your frequency instead. |
| Also send to | Adds another address — a colleague or a manager, say. Only admins and members see this. |
The dialog lists everyone who gets the report, each with their frequency and who added them, and a control to remove an address.
| Role | Subscribe yourself | Add or remove other addresses |
|---|---|---|
| Admin | ✓ | ✓ |
| Member | ✓ | ✓ |
| Viewer | ✓ |
Managing your subscriptions
Open Settings → Report emails to see every report you get in the current organization. From there you can change a report's frequency or unsubscribe.
Every email also carries an unsubscribe link. A team member's email links back to the Report emails settings page. An outside address gets a one-click unsubscribe that, after a single confirmation, stops every report sent to that address at that frequency in this organization — not only the report in the message. To drop one report but keep the rest for that address, remove it from the report's Subscribe dialog instead.
Removing a person from the organization ends every subscription tied to them — their own, any address they added, and any report sent to their email. If a report's numbers can't be retrieved when an email is prepared, that report is left out of that run rather than sent with incomplete figures.