Events
Events is where you look at a period rather than the last hour. Open it from Analytics → Events in the sidebar. A row of tabs across the top switches between the explorer and six views built for the events that matter most:
| Tab | What it covers |
|---|---|
| All events | Every tracked event, filterable, with a breakdown by any field. |
| Page views | How much your site is read, when, and what. |
| Time on site | How long readers stay. |
| Content gates | How often readers meet a gate, and how often that leads to a login or sign-up. |
| Sign-ups | Readers who became members, and what they saw first. |
| Logins | Members signing back in, and where they do it. |
| Purchases | Revenue from completed checkouts. |
Each tab shows its event count for the selected range. The date range control sits at the right of the tabs, and your range, property, and product choices carry over as you switch tabs.
Every view compares its headline numbers with the period just before the range, marked vs previous period.
All events
The explorer lists every event Allegro has recorded, newest first, and lets you narrow it down until you find the pattern or the single event you're after.
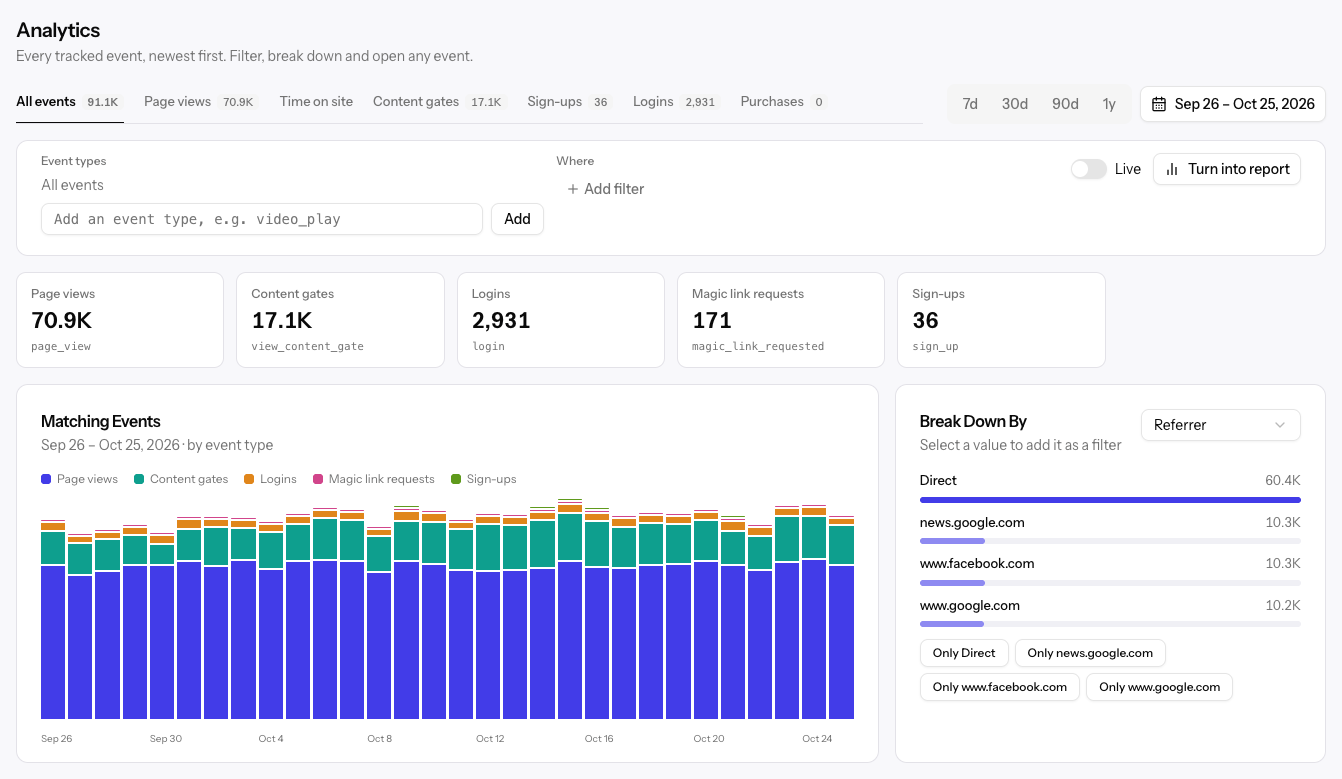
Choosing events
Under Event types, add the events you want to see. Suggestions come from the
events recorded in the range, and you can type any custom event name your site
sends, such as video_play. With nothing selected you see All events.
The tiles below the controls show the busiest event types. Click a tile to add or remove that type.
Filtering
Click Add filter under Where to keep only events that match a field. Pick the field, a match (is, is not, contains, or does not contain), and a value. You can add up to 10 filters; click a filter's chip to remove it.
| Area | Fields you can filter and break down by |
|---|---|
| Event | Event type |
| Page | Page path, Page title, Section, Content type, Hostname, Property |
| Source | Referrer, UTM source, UTM medium, UTM campaign |
| Interaction | Interaction type, Gate type, Object type, Object ID |
| Reader | Device, Browser, Operating system, Reader status (registered or anonymous) |
Breaking down
Matching Events charts the events over the range, stacked by type. Break Down By ranks the top values of any field, Referrer by default. Click Only beside a value to add it as a filter, which is the quickest way to drill from "where is traffic coming from" to "what did readers from that site do".
Event Stream
The Event Stream lists matching events newest first, 50 at a time, showing the time, event, page, source, and whether the reader was registered or anonymous. Bots are excluded. Use Older events to page back and Back to newest to return.
Turn on Live to refresh the stream and tiles every 15 seconds.
Event details
Click any event to open its details.
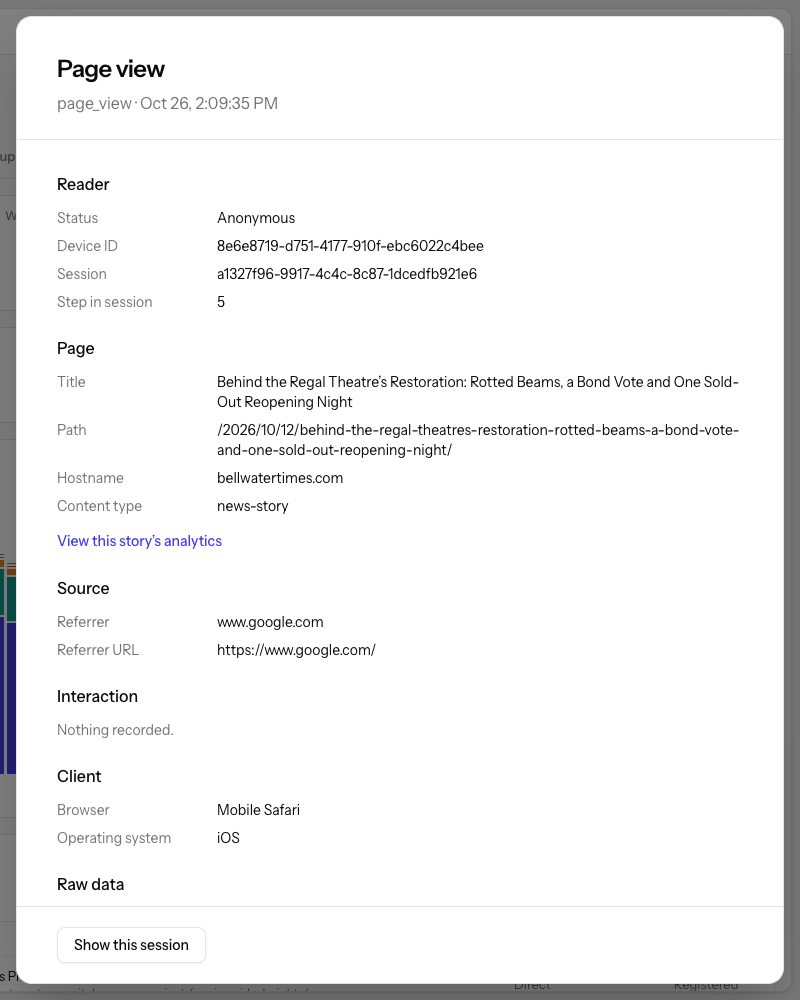
The panel shows the reader, the page, the source, any interaction or gate involved, the browser and device, and the raw event data. From there you can:
- Show this session to filter the explorer to every event in the same visit. A banner reads Showing one session; click Show all sessions to go back.
- Open the reader timeline for a registered reader.
- Open the story view for a page event.
Turning a search into a report
Once the explorer shows what you want to keep, click Turn into report. The report builder opens with your event types, filters, and breakdown already filled in, counted per day.
Page views
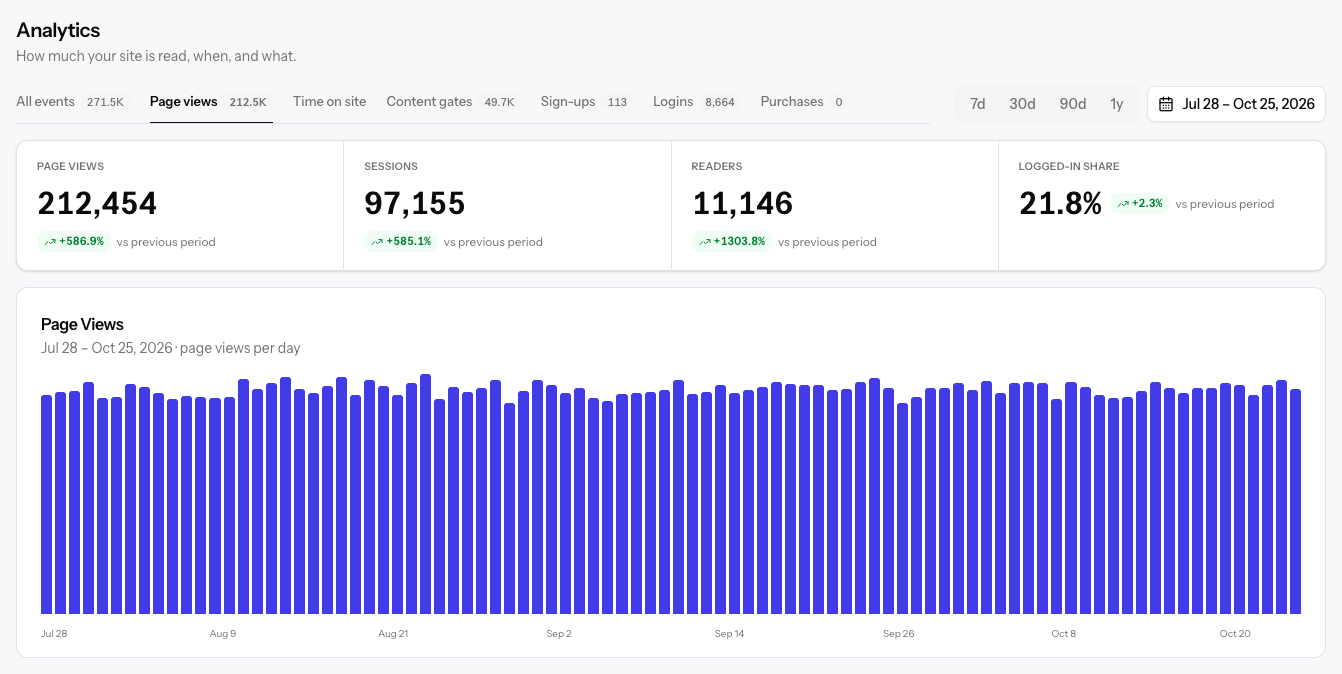
| Stat | What it counts |
|---|---|
| Page views | Every page view in the range. |
| Sessions | Visits, however many pages each one viewed. |
| Readers | Unique readers. |
| Logged-in share | The share of page views by signed-in members. |
Below the stats:
- Page Views charts views per hour, day, or week.
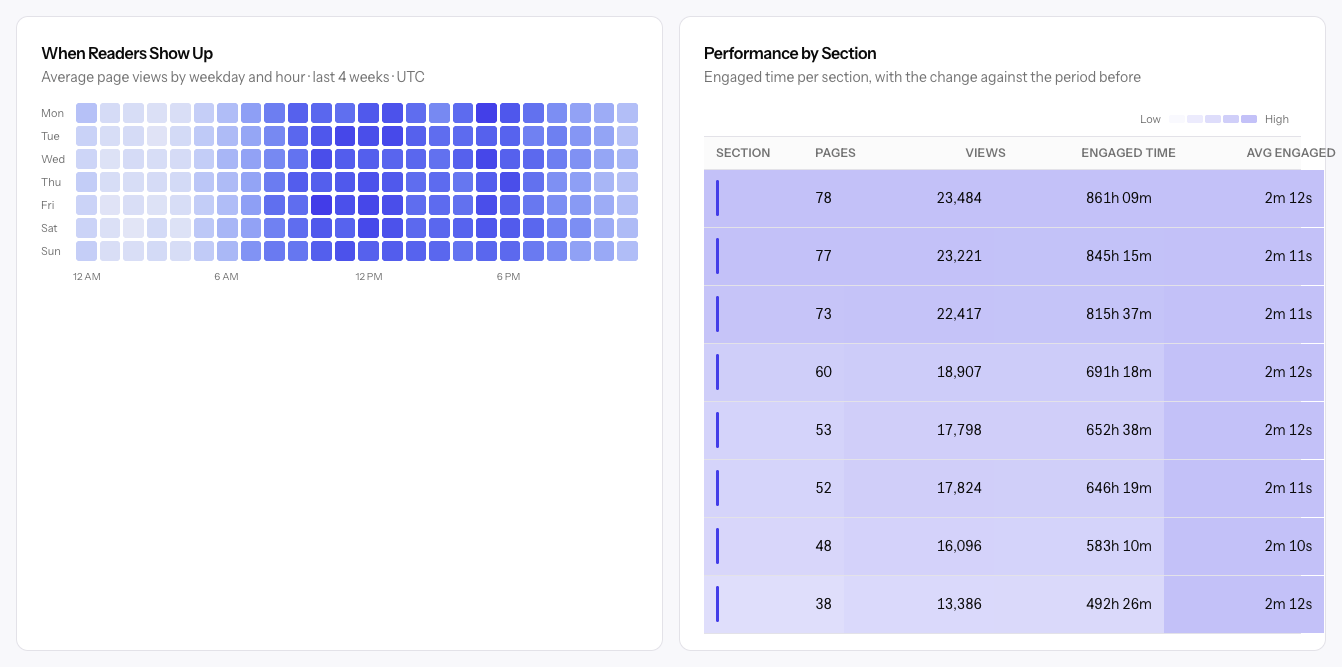
- When Readers Show Up is a heat map of average page views by weekday and hour over the last four weeks, in your organization's time zone. Use it to time newsletters and publishing.
- Performance by Section lists each section's pages, views, engaged time, and average engaged time, with a trend line and the change against the previous period.
- Top Content by Engaged Time ranks stories by total engaged time. Click a story to open its story view.
Time on site
Time on site is measured from the heartbeat each page sends while it's open and in front of the reader, so time in a background tab doesn't count.
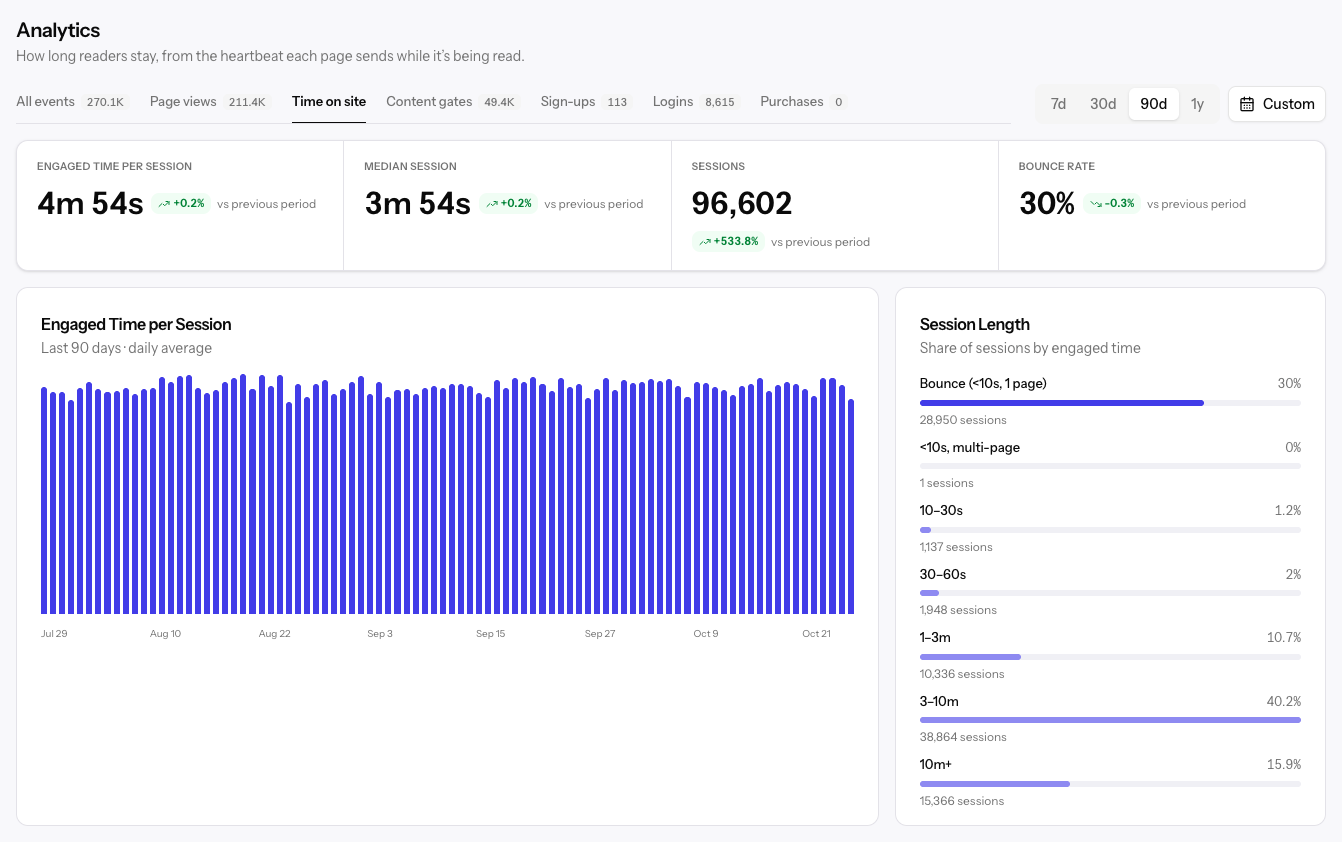
| Stat | What it counts |
|---|---|
| Engaged time per session | Average engaged time across sessions. |
| Median session | The middle session, which a few very long visits can't skew. |
| Sessions | Visits in the range. |
| Bounce rate | Sessions under 10 seconds on a single page. Lower is better, so a drop shows in green. |
Session Length splits sessions into bands from Bounce to 10m+, and Engaged Time by Story ranks stories against the site average.
Content gates
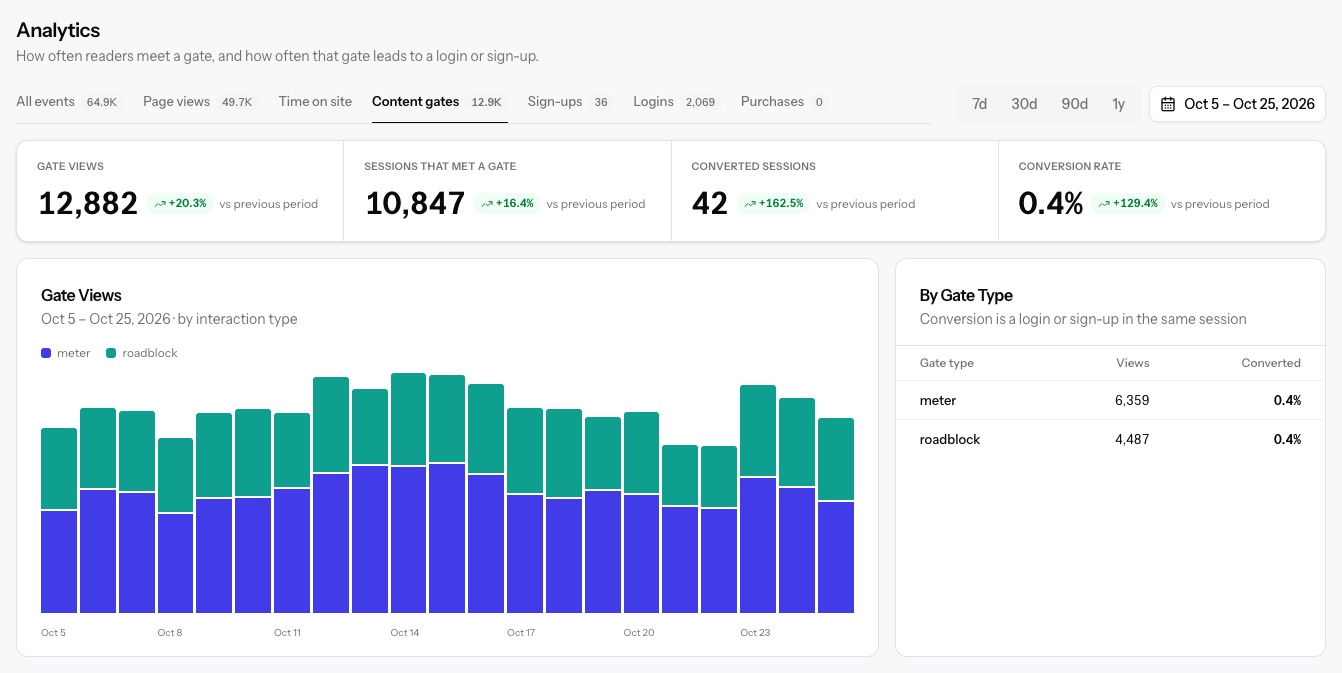
| Stat | What it counts |
|---|---|
| Gate views | Every time a gate was shown. |
| Sessions that met a gate | Visits that saw at least one gate. |
| Converted sessions | Visits where a reader met a gate and then logged in or signed up. |
| Conversion rate | Converted sessions as a share of sessions that met a gate. |
Gate Views stacks views by interaction type, such as meter and roadblock. By Gate Type compares the conversion of each type. Stories Behind Gate Conversions shows where readers met the gate that converted them, and Latest Gate Events lists the 10 most recent gates; click one for its details.
Sign-ups
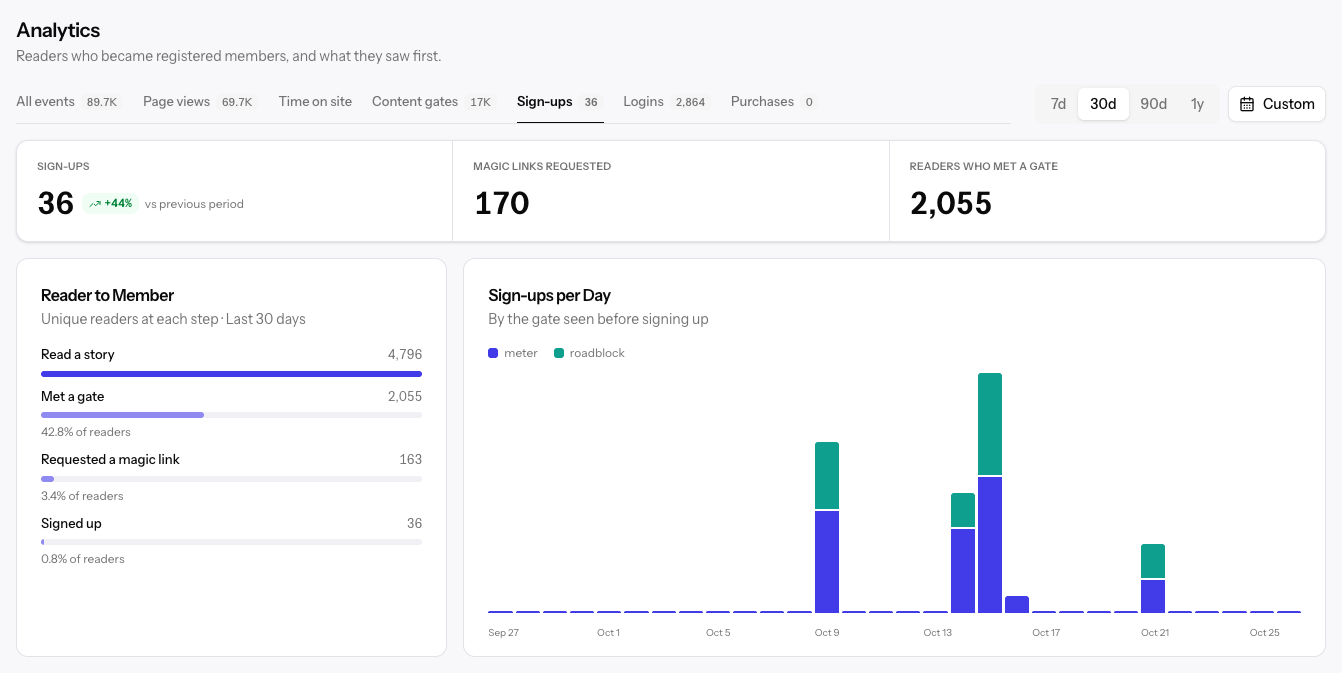
The stats show Sign-ups, Magic links requested, and Readers who met a gate. Below them:
- Reader to Member is a funnel of unique readers: read a story, met a gate, requested a magic link, and signed up, with each step's share of readers.
- Sign-ups per Day stacks each day's sign-ups by the gate the reader saw before signing up.
- Content That Converts lists the pages sign-ups happened on.
- By Member Level shows the membership level held when signing up.
Logins
The stats show Logins and Members who logged in. Below them, Logins charts the daily count, Who Logs In splits logins by member level, Device splits them by mobile, desktop, and tablet, and Where Members Log In lists the pages they logged in from.
Purchases
The stats show Revenue, Purchases, and Average order. Revenue charts completed revenue over time, By Status counts every checkout started in the range by its outcome, and Revenue by Product breaks completed purchases down by product, with purchases, revenue, and average price.
Reader timeline
The reader timeline follows one registered reader across their visits. Open it from the details of any event by a registered reader in the event details.
The header shows the reader's name and email, when Allegro first saw them, and their page views, number of devices, and primary device. Open in Audience opens their member record.
The Sessions list on the left shows each visit with its start time, number of events, source, and device, and notes the visits where the reader signed up or logged in. Select a visit to see its events in order:
- Page views show the page title and where the reader came from.
- A sign-up shows how many gates and page views came before it.
- Other events show their interaction and page.
Click Show these in Events to open the selected visit in the explorer. The timeline covers the reader's 500 most recent events.
Related
- Analytics — The Pulse, filters, and traffic channels
- Reports — Save any view of events as a shared report
- Story view — One story in depth