Testing Journeys
Two tools show you which journey a visitor follows and why. Evaluate runs a simulated visitor against the journeys in the editor without touching your site. Debug on site opens a real page on your site with an overlay that explains every automatic Interaction's decision for your own browser.
Evaluate (Simulator)
Click Evaluate in the Journeys header to open the Evaluate journeys panel.
- Click + Add attribute and pick an attribute, then enter the value the simulated visitor should have. Identified and Authenticated are pre-filled as false. Clear resets a value to unknown, and × removes the attribute.
- Repeat for every attribute your journeys test. Anything you leave blank is treated as unknown — exactly as on your site when a value cannot be resolved — so conditions on it are false.
- Click Evaluate.
Each journey card gets a badge: Matched · winner on the first journey that matched, Matched on later journeys that would also have matched, and No match on the rest. The winning journey and its true conditions flash in the builder. If nothing matches, the visitor lands on Everyone else.
Below the button, the panel names the result, for example Matched: VIP readers, and lists every journey with a trace you can expand. The trace shows each group (All of or Any of) and each condition marked ✓ or ✗, with the value the condition expected and the simulated visitor's actual value.
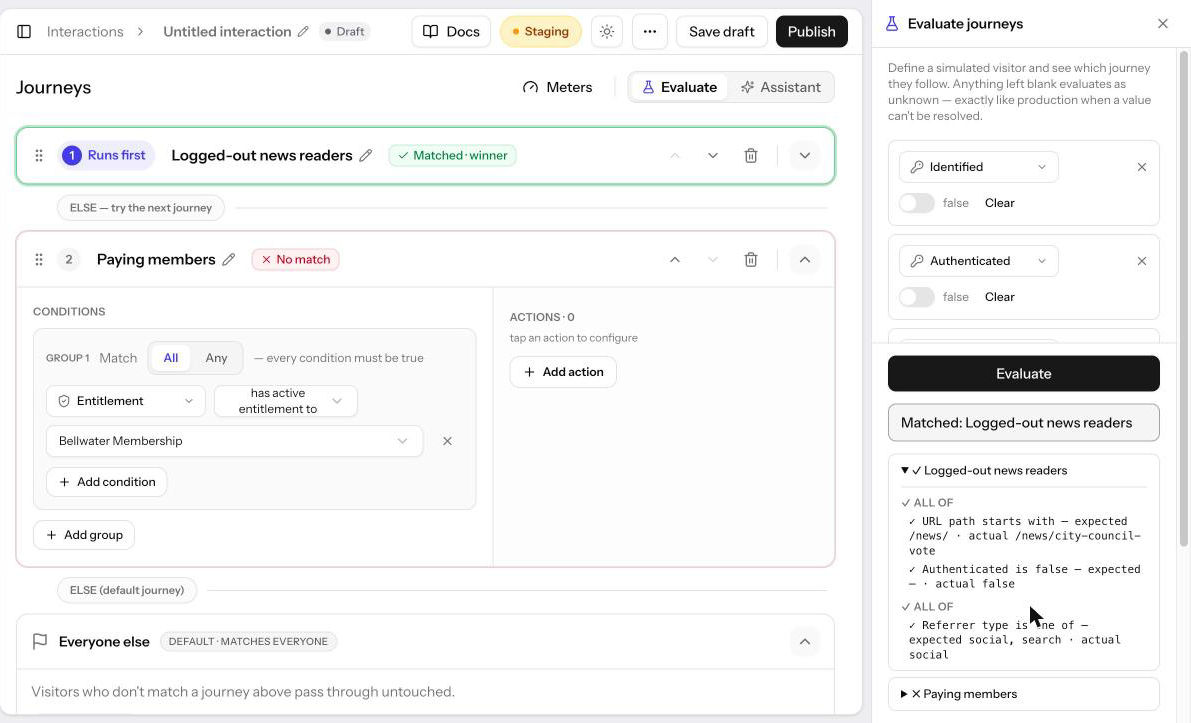
The simulator evaluates the journeys as they are in the editor, unsaved edits included, and never runs actions or reads real member data. Results clear whenever you change a journey. Derived attributes (Continent and Privacy law) cannot be entered directly; set Country and Region instead. Referrer type can be entered directly, or left out and worked out from Referrer.
Debug on Site
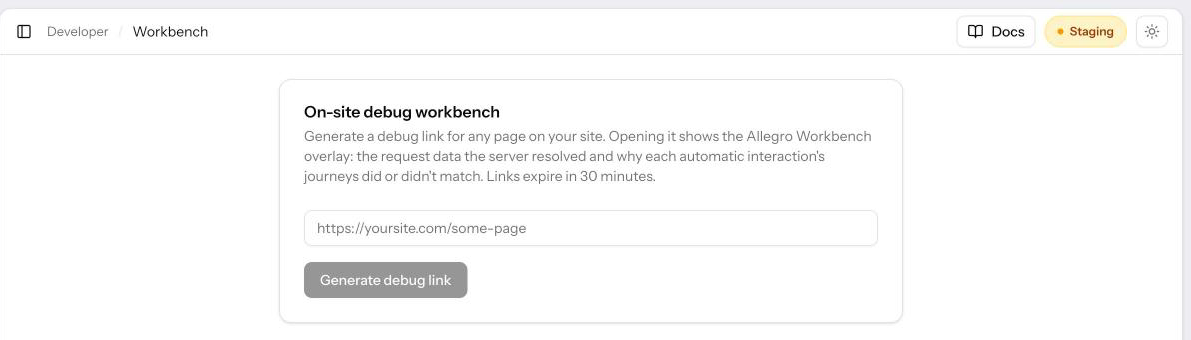
Debug on site lets you load a page on your live site and see, for every published automatic Interaction, what Allegro resolved about the request and which journey it chose.
- Save the Interaction if you have not already, then choose Debug on site from the ⋯ menu in the header. (The same tool is available for all Interactions under Developer → Workbench in the dashboard sidebar.)
- Enter a URL from your site. It must start with
https://. - Click Generate debug link, then Copy or open the link.
The page loads with the Allegro Workbench pill in the bottom-left corner. Click it (or press Ctrl+Shift+A) to open the workbench panel, docked to the bottom of the page:
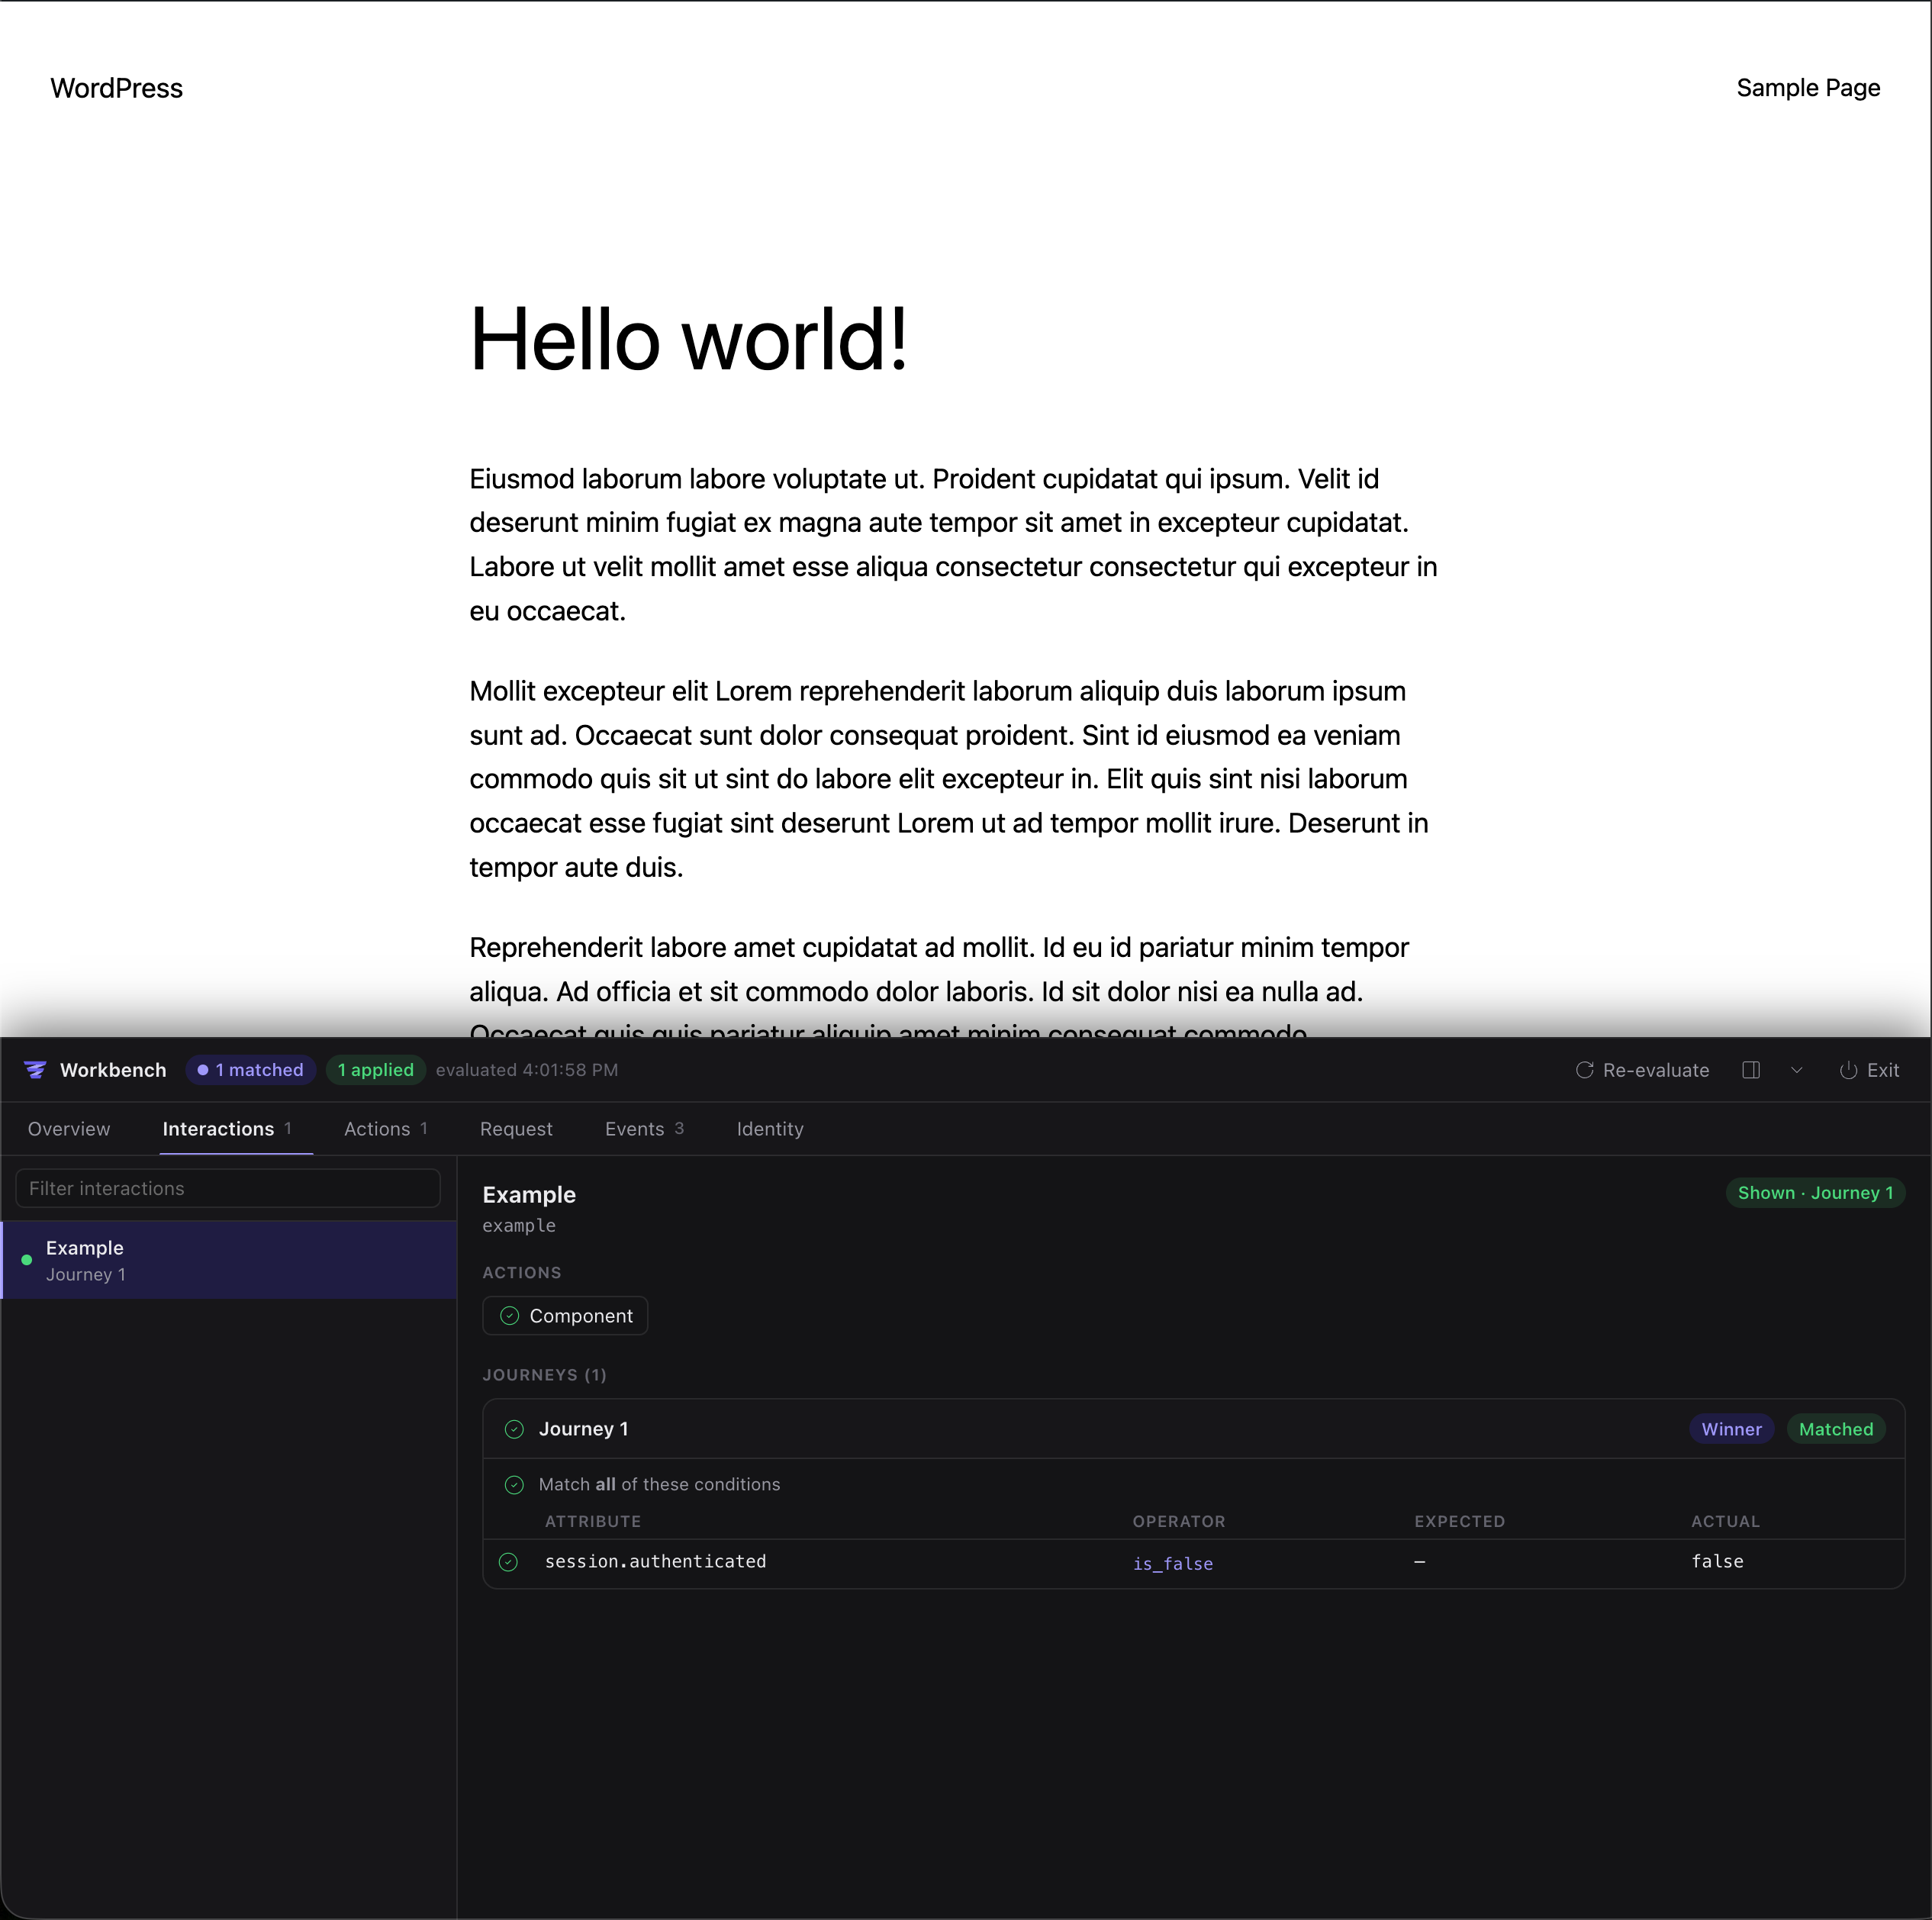
- Overview — which Interactions are shown on this page and which are not.
- Interactions — each published automatic Interaction with its journeys marked matched or not and the winner named (or Everyone else (default)), down to the expected and actual value of every condition.
- Actions — each action that ran, and whether it applied or failed.
- Request — what the server resolved for this page view, grouped as Request, Device, Geo, Time, Session, and Member, with the reason for anything it could not determine.
- Events — Allegro events as the SDK records them, live.
- Identity — the member, device, and session IDs for your browser.
Click Re-evaluate to run targeting again without reloading — useful after signing in on the site. The workbench stays on in every tab on that site until you click Exit in the panel, or for up to 30 days.
The overlay shows the decision for your browser: member conditions reflect your own session, and location and device reflect the machine you are using. Actions still render as they would for any visitor. To test a different kind of visitor, use the simulator above.
Related
- Journeys — How evaluation and unknown values work
- Cohorts — Evaluate a cohort's own conditions the same way
- Potential Reach — How many visitors a journey would reach
- Previewing a Draft — Preview a manual-embed draft on your site